The COPUS Analyzer Tool

The COPUS Analyzer Tool is your free, easy-to-use solution for conducting classroom observations that reveal both instructor and student behaviors throughout a class session - no login required!

New Features! Users no longer need to record COPUS observations prior to using this app. Anyone can use this app to record COPUS observations while the class is occurring!


Built on a Proven Framework

This tool is built around the Classroom Observation Protocol for Undergraduate STEM (COPUS) , a research-based instrument designed to capture how instructors and students spend their time during class. Rather than evaluating teaching quality, COPUS provides a clear snapshot of classroom dynamics by categorizing behaviors such as lecturing, group work, questioning, and more - offering a nonjudgmental lens into teaching and learning practices.


Reflect, Evaluate, Learn

With the COPUS Analyzer Tool, you can:

  • Reflect professionally on your teaching style and classroom engagement.
  • Conduct informal or formal evaluations of instructional practices.
  • Gain valuable insights into your own or colleagues' teaching approaches.

Whether you're new to classroom observation or a seasoned educator, the COPUS Analyzer Tool empowers you to make data-informed decisions to enhance student learning. And best of all, it's completely free, with no account or login required. Just observe using the built-in COPUS tool or upload existing observations and explore!


This material is based upon work supported by the National Science Foundation under Grant No. CAREER #1552448. Any opinions, findings, and conclusions or recommendations expressed in this material are those of the authors and do not necessarily reflect the views of the National Science Foundation.

If you wish to use this app for a COPUS observation that has not yet been conducted, fill out the About You tab and select the 'Perform the COPUS live right now' option to record a brand new COPUS observation. Once finished, the app will allow you to download the COPUS observation (for later use in the Analyzer or for your own records) or send it straight to be analyzed.

If you have already conducted a COPUS observation and have the data in a spreadsheet, format it to one of the following templates depending on how many and what kind of COPUS observations you ahve collected:

  • If you have conducted a full COPUS minute-by-minute for one or more courses, use the minute-by-minute template (MS Excel).
  • If you you only have the percentage of each COPUS behavior for one or more courses, use the summary template (MS Excel).
  • If you are using the COPUS Analyzer Tool for inter-rater reliability and multiple observers have filled out a COPUS for the same observation, use the summary template (MS Excel).
  • Be sure to check out Helpful Info tab to see details about how to format your COPUS to match what is required by this app and common troubleshooting issues. After you have formatted your COPUS observation correctly, head back to the About You tab and select 'I have a spreadsheet with the COPUS results I'd like to upload.' Answer the remaining questions so the appropriate results can be displayed for your data.

    Don't know how to COPUS or don't have time COPUS your class? No problem! Shoot us an email and we'll have a member of our research time get in touch with you to determine how you can confidentially share a recording with us so that we can COPUS the class for you. This service will be subject to the availability of the research team.

    The person coding this is a researcher, not a web designer, so it can be a bit finnicky. If you run into troubles, contact me and I'll help you get it sorted out.

    You can convert the minute-by-minute into a summary file that shows the percent of 2-minute intervals spent on each behavior for each instructor for each observation. Additionally, each observation will contain a cluster number that corresponds to the instructional profile that best matches that observation (for more information, see the link included in the profile assignment on the COPUS Analyzer tab). Simply click the Download Summary button to download the summary file.
    You can view and download customizable heat maps that are displayed for each of the 25 COPUS behaviors for each minute in an observation. If you want less/more COPUS behaviors, simply check the boxes to include/remove them. Click the Download HM Behaviors button to download a .png image file of the heatmap currently displayed.
    Heatmap of COPUS categories: You can view and download customizable heat maps that display 8 broad categories (4 student, 4 instructor) for each minute in an observation. This categorization is based on the work from Smith et al. (2014). If you want less/more COPUS collapsed codes, simply check the boxes to include/remove them. Click the Download HM Categories button to download a .png image file of the heatmap currently displayed.
    You can view the aggregate percentages for each class of a selected instructor. Simply click the Download Aggregate button to download a .png image file of the scatter plot currently displayed. Points that are higlighted with a grey outline represent the class that is currently selected in the interface.
    If you have uploaded multiple observations per instructor, you can generate a report for each instructor that will include several visualizations for all observations of an instructor teaching in the selected semester and class, including:
      a) one graph that shows the percent of each COPUS behavior for all observations (for both minute-by-minute and summary files),
      b) a heat map that shows each COPUS behavior for each minute of class (for minute-by-minute files), and
      c) a heat map that shows each COPUS category for each minute of class (for minute-by-minute files).
    To generate this report in a pdf format, simply click the Download Report button.

    If you have a data set with multiple coders for the same instructor's observation(s), you can access inter-rater reliability information. Be sure to answer the question on the demographics that you are using the tool for inter-rater reliability/training. Once you upload your data, you will see two tables that look similar:

      - The top table shows all of the coders for the same observation (remember that the same coder and the same observation needs to be spelled exactly the same) . For example, if you have 4 coders for the same observation, the graph will show the total number of coders (up to 4) who coded each of the 25 behaviors throughout each minute of the class. If all 4 coded the behavior or none of the 4 coded the behavior, that is perfect agreement. If only 1, 2, or 3 marked a code, that represents disagreement. White areas represent perfect agreement and deeper reds represents greater disagreement.
      - The bottom table shows only the individual coders' coding, which you can select in the drop down menu for quick reference when differences arise.

    Both of these tables can be exported in a .csv format (opens in Excel).

    Finally, this program will calculate percent agreement and Fleiss' kappa for the selected observation. The values will show at the bottom of the second table. These measures are good for determining how similar all the coders rated the same video. If the graph isn't big enough to fit the numbers (this can happen for classes that are longer than 50 minutes), use the slider to increase the height of the plot.


    About You

    To prevent the bots from uploading junk, please let us know who you are and some background information about the course being observed. When you hit 'SUBMIT' below, you will be given an opportunity to allow us to use your submitted information for research purposes, but you may also decline and still use the site fully. However, please be aware that this site does collect all information you provide for diagnostic and feedback purposes regardless of if you choose to allow us to use it for research purposes.

    Thanks, your response was submitted successfully!

    You may now click on 'COPUS Analyzer' tab (or the 'IRR & Training' tab if you are doing inter-rater reliability) to anlayze your COPUS data!

    Helpful Info

    The following codes are from the Classroom Observation Protocol for Undergraduate STEM (COPUS) paper previously published


    Instructor Behaviors

    Lec = Lecturing (presenting content, deriving mathematical results, presenting a problem solution, etc.

    RtW = Real-time writing on board, doc. projector, etc. (often checked off along with Lec)

    FUp = Follow-up/feedback on clicker question or activity to entire class.

    PQ = Posing a non-clicker question to students (non-rhetorical).

    CQ = Asking a clicker question (mark the entire time the instructor is using a clicker question, not just when first asked).

    TAnQ = Listening to and answering student questions with entire class listening.

    MG = Moving through class guiding ongoing student work during active learning task.

    OoO = One-on-one extended discussion with one or a few individuals, not paying attention to the rest of the class (can be along with MG or TAnQ).

    DV = Showing or conducting a demo, experiment, simulation, video, or animation.

    Adm = Administration (assign homework, return tests, etc.).

    TW = Waiting when there is an opportunity for an instructor to be interacting with or observing/listening to student or group activities and the instructor is not doing so.

    TO = Other - explain in comments.


    Student Behaviors

    L = Listening to instructor/taking notes, etc.

    Ind = Individual thinking/problem solving. Only mark when an instructor explicitly asks students to think about a clicker question or another question/problem on their own.

    CG = Discuss clicker question in groups of 2 or more students.

    WG = Working in groups on worksheet activity.

    OG = Other assigned group activity, such as responding to indstructor question.

    SAnQ = Student answering a question posed by the instructor with the rest of class listening.

    SQ = Student asks question.

    WC Engaged in whole class discussion by offering explanations, opinion, judgment, et. to whole class, often facilitated by instructor.

    Prd = Making a predication about the outcome of a demo or experiment.

    SP = Presentation by student(s)

    TQ = Test or quiz

    SW = Waiting (instructor late, working on fixing AV problems, instructor otherwise occupied.

    SO = Other - explain in comments.


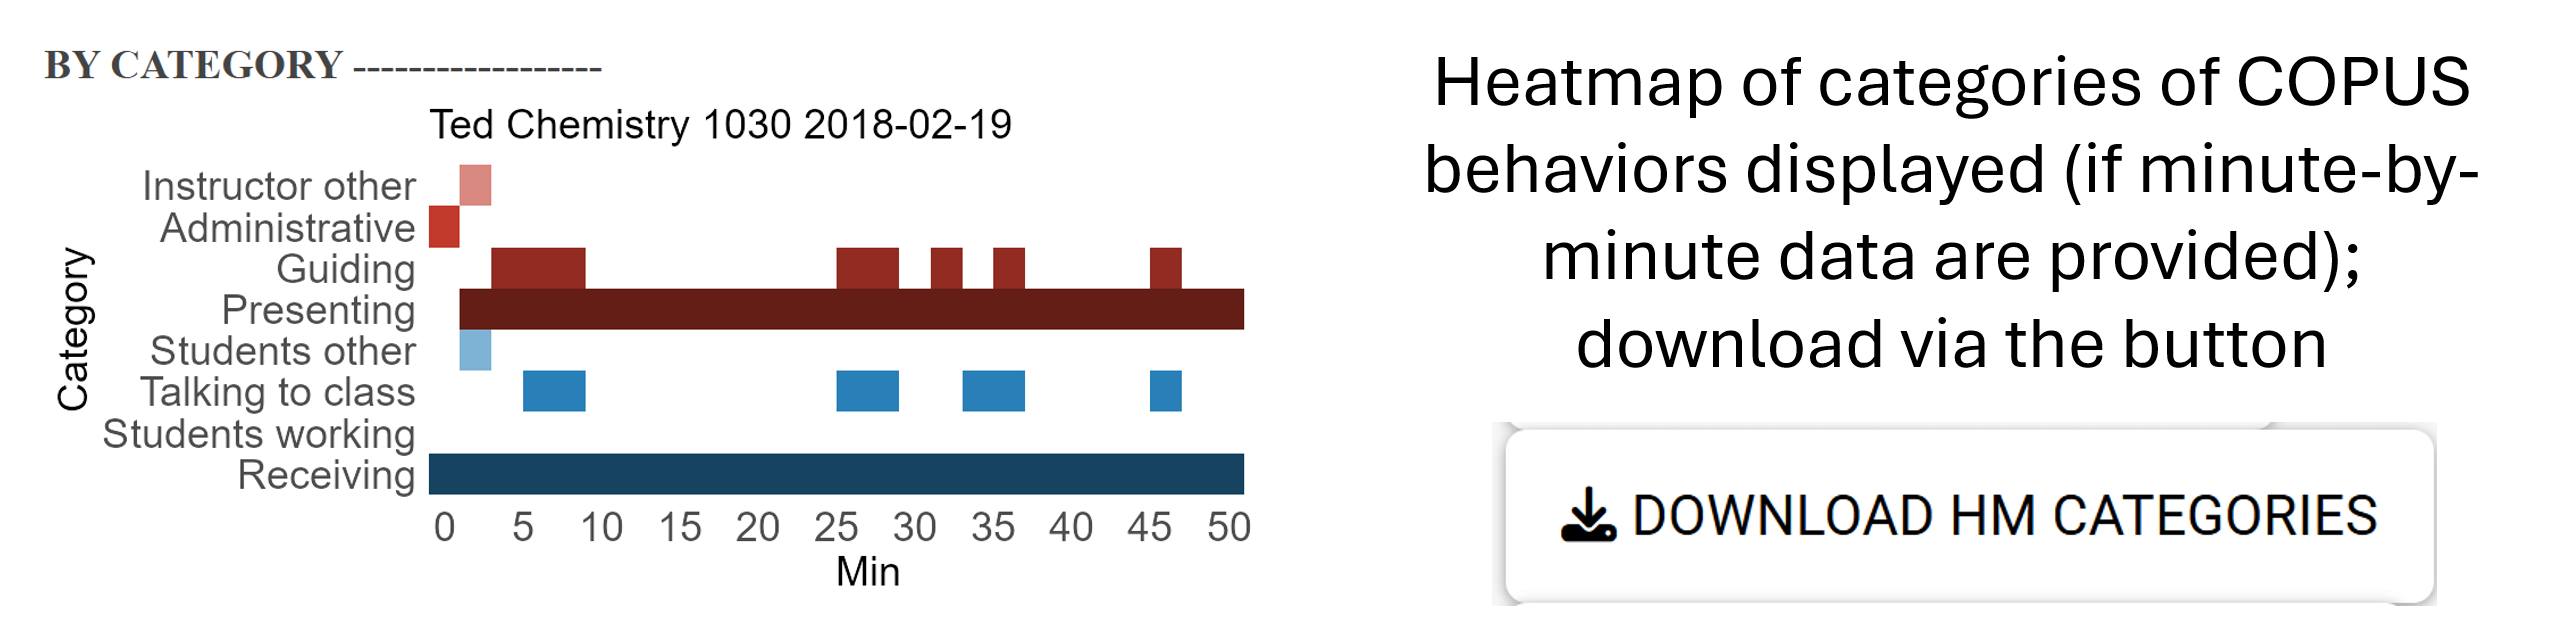
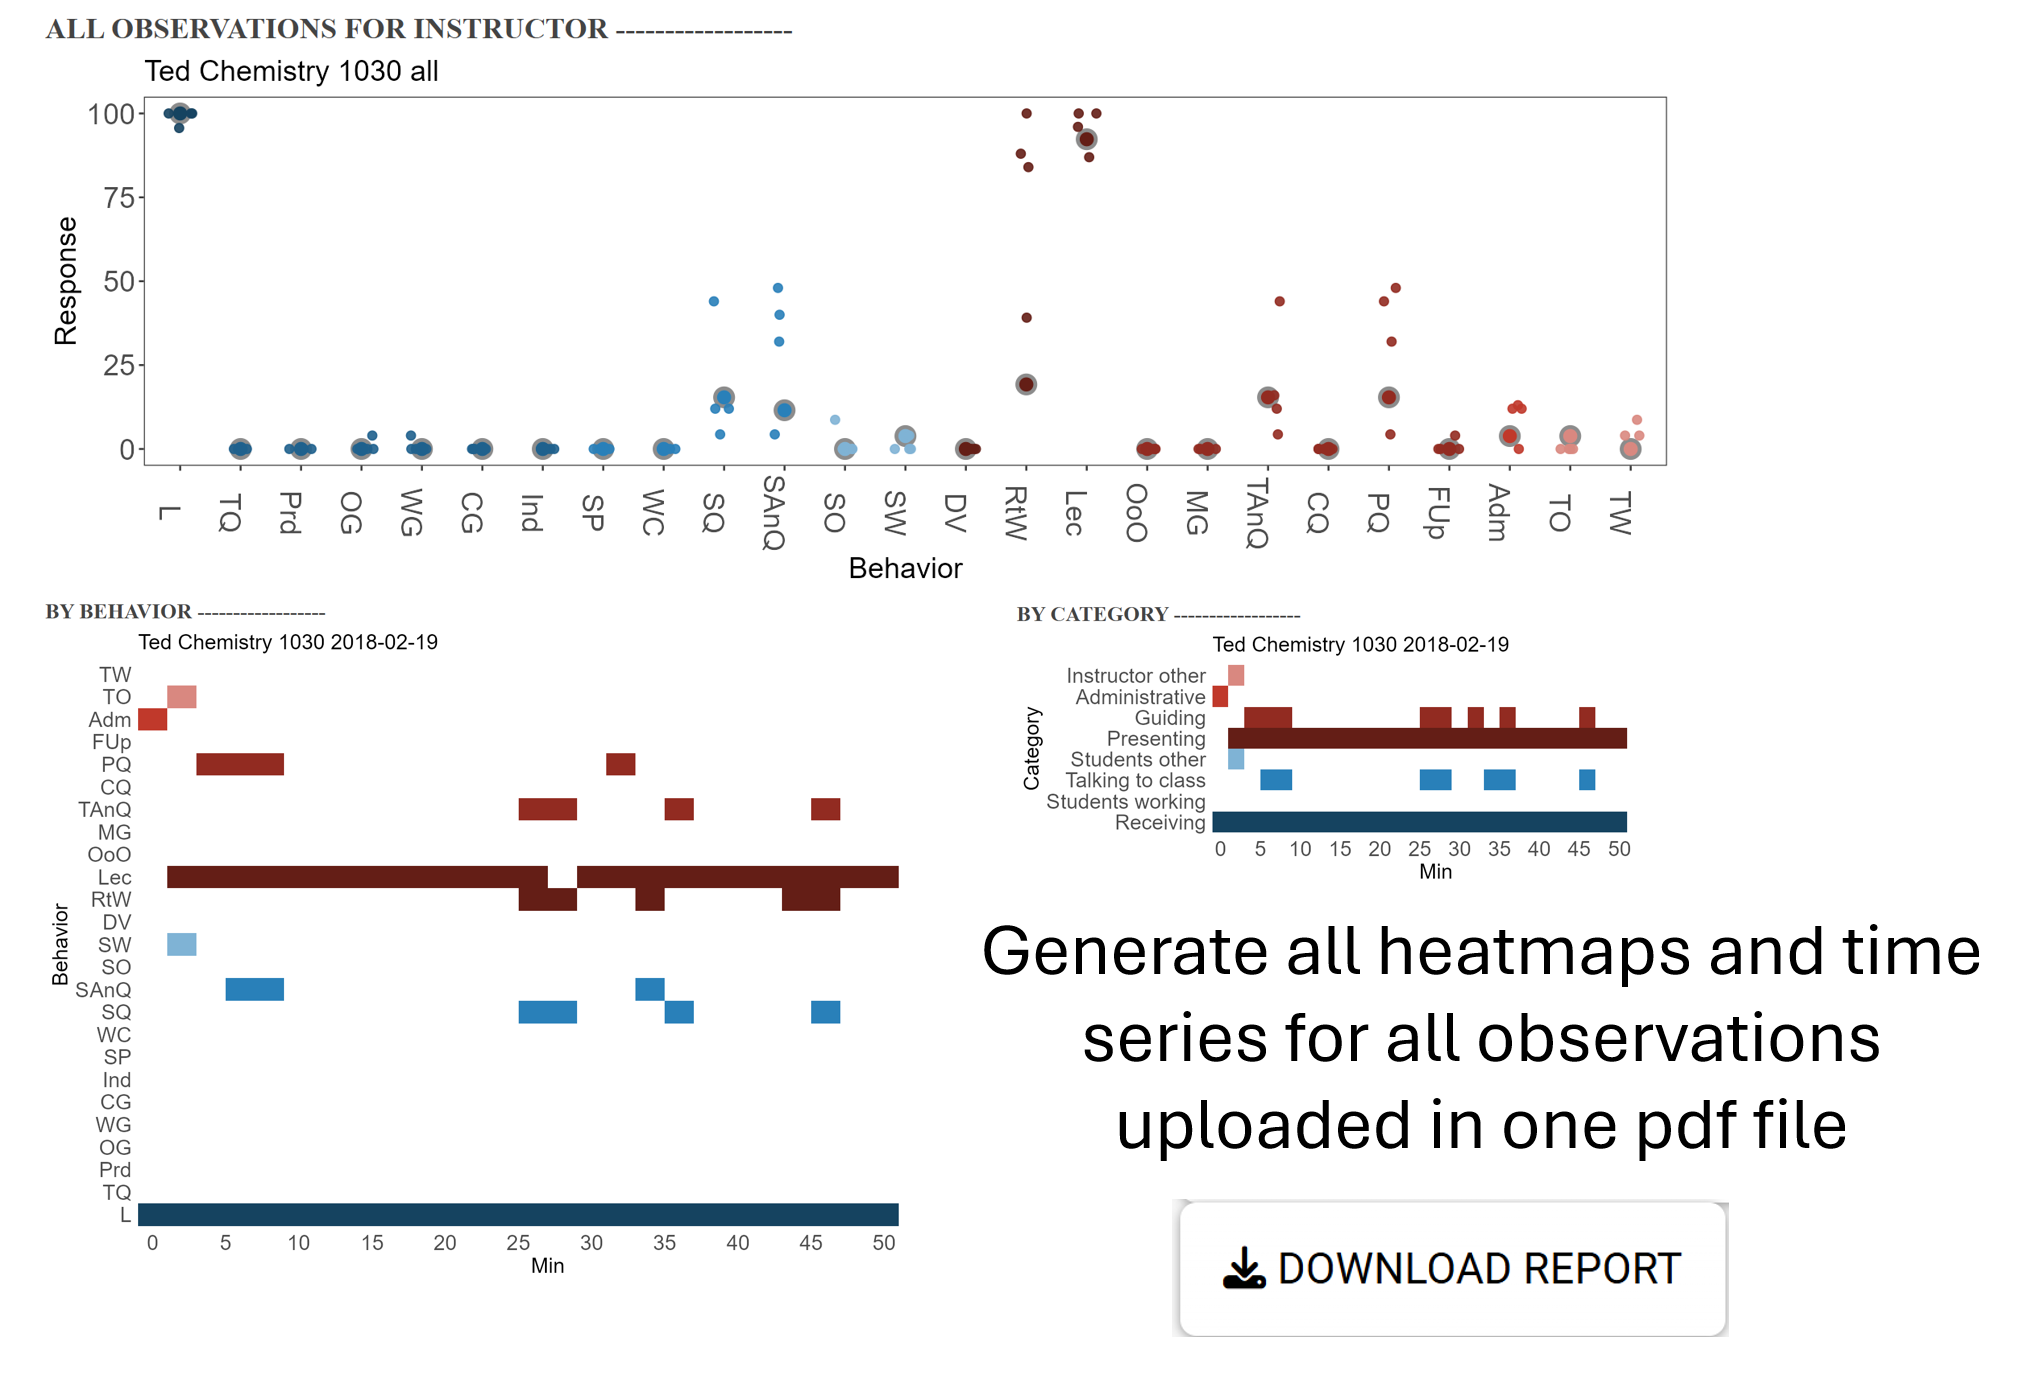
    Instructor Categories (Collapsed Codes)

    Presenting = Lec, RtW, or DV

    Guiding = FUp, PQ, CQ, TAnQ, MG, OoO

    Administrative = Adm

    Instructor other = TW, TO


    Student Categories (Collapsed Codes)

    Receiving = L

    Talking to class = SAnQ, SQ, WC, SP

    Students working = Ind, CG, WG, OG, Prd, TQ

    Student other = SW, SO

    Formatting Requirements When Uploading Data

    This tool will accept data in three formats (you can download each template at the top of this page). All are .xlsx files.

      1. The Minute-by-Minute Template (xlsx) (download here) is for instructors/researchers who have COPUS data for every 2-minute intervals of each class. This can be one class for one instructor or multiple classes for multiple instructors. This template is also used if researchers have multiple coders COPUSing the same video(s) in a training context or for inter-rater reliability.
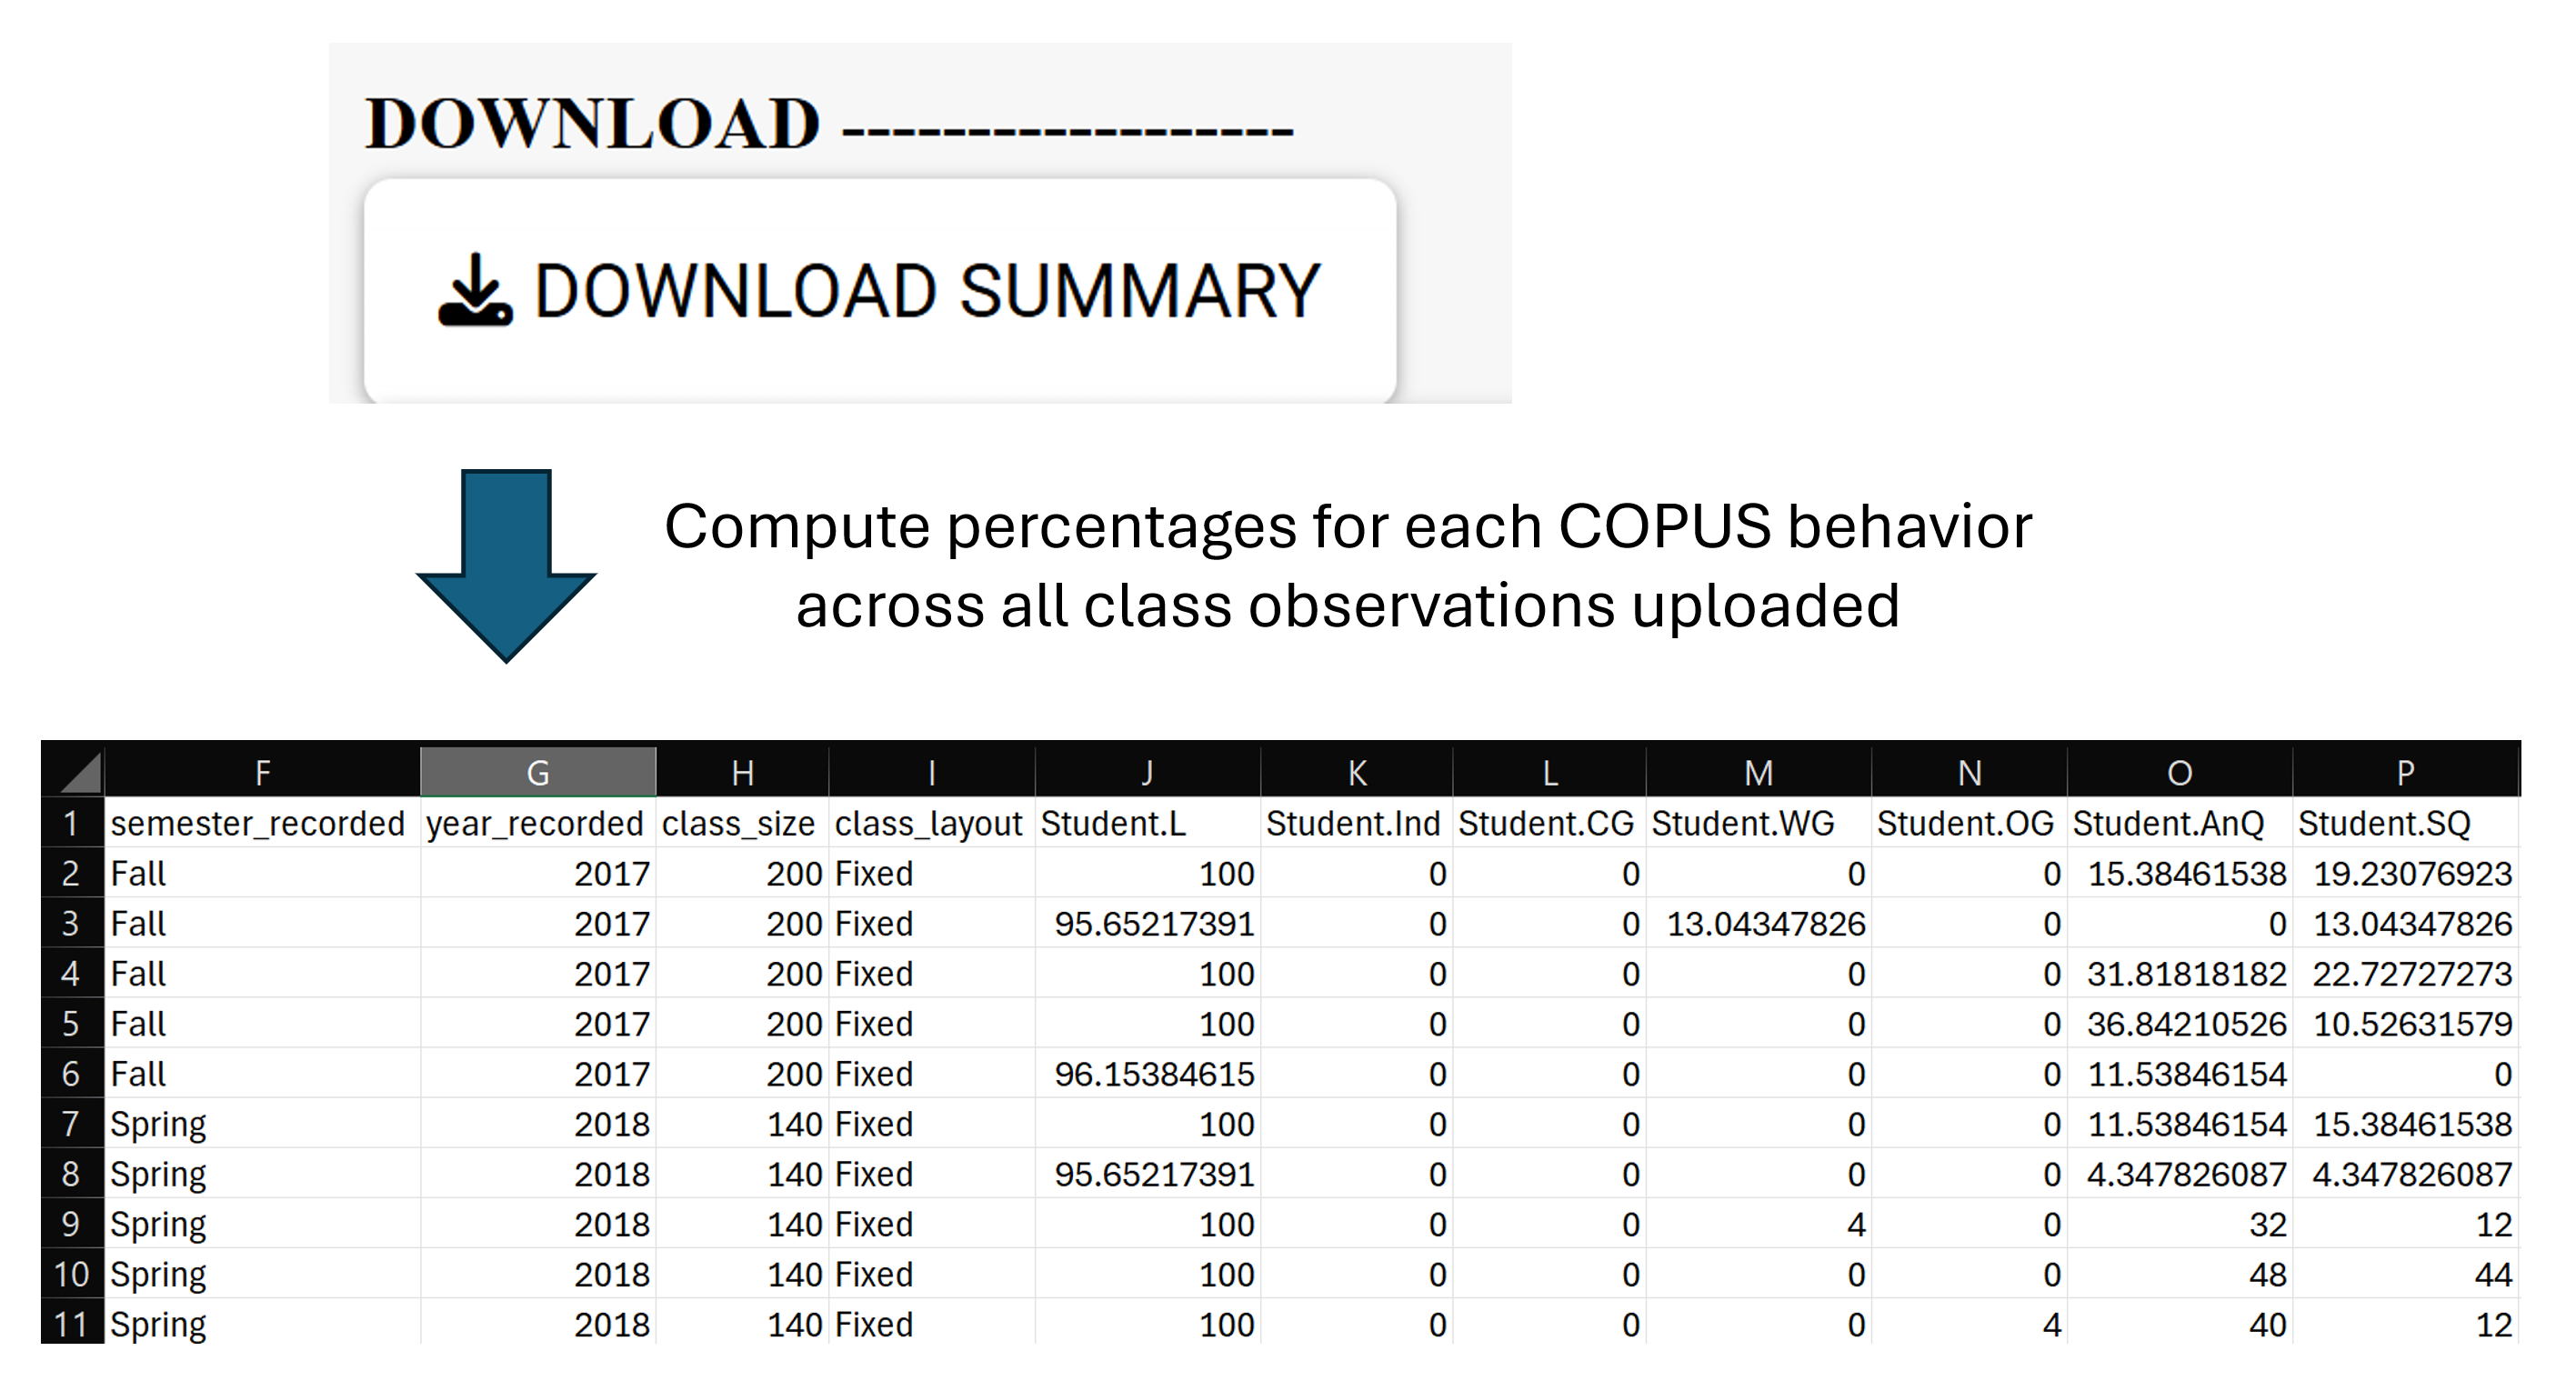
      2. The Summary Template (xlsx) (download here) is for instructors/researchers who have COPUS data for each classroom observation in percent of two-minute intervals. Each of the template files have a pre-filled in entry equivalent to one instructor's observation to exemplify what the data should look like.
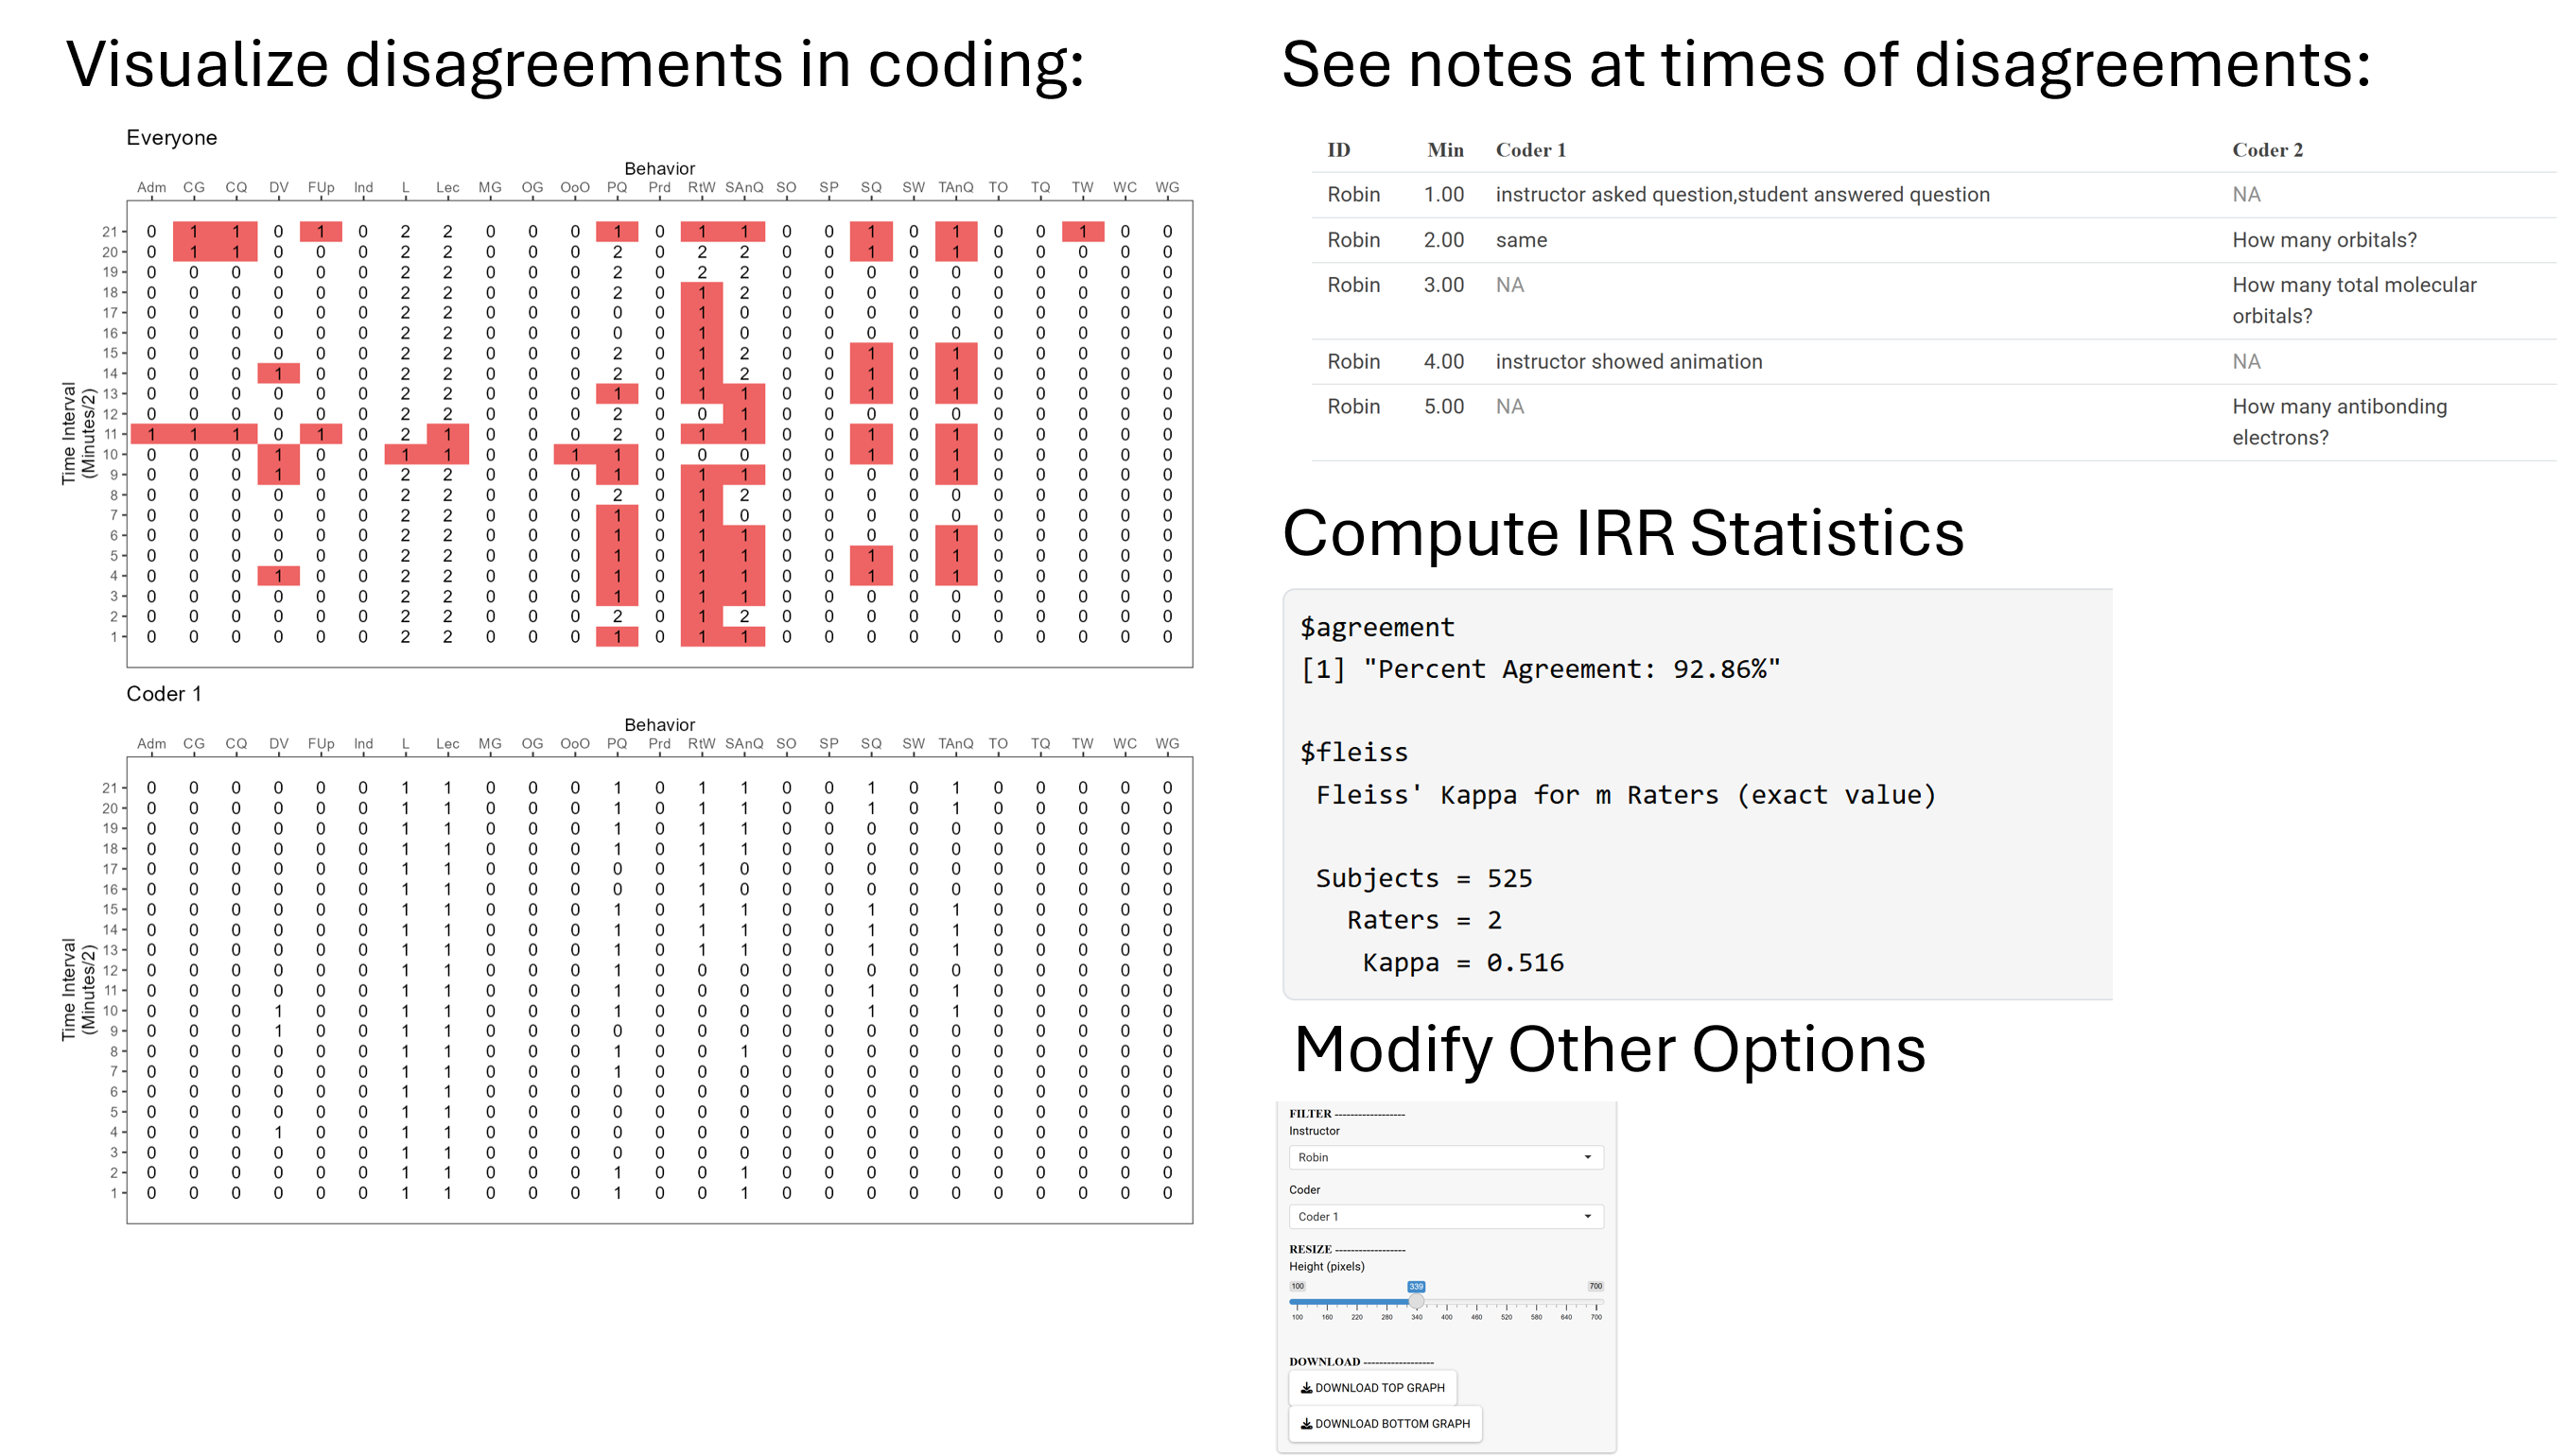
      3. The Inter-rater Reliability Template (xlsx) (download here) is for researchers who have COPUS data for each classroom observation in every 2-minute intervals of each class. This template should only be used if you have multiple coders observing the same class(es) and you want to calculate the precent agreement and kappa values of those coders.

    The format of the required variables are as follows:

      time: On a minute-by-minute file, you will need to enter 1, 2, 3... for each time block, starting at 1 and going until the end of class (25 time blocks for a 50 minute class). Do no enter actual times (i.e. 8:00AM) or timestamps (i.e. 0:01:00 - 0:03:00).
      instructor: Can be entered as strings (e.g. 'Instructor 1' or 'Frank') or numbers (e.g. 1, 2, 3...). Please ensure that data entered in this column de-identify the instructor (i.e, if John Smith taught the course do not enter John Smith in this column, rather, use numbers or an acronym).
      course_subject_code: Discipline or department course is in (e.g. 'Chemistry', 'CHEM', etc.).
      course_number: Actual course number (e.g. 101), can also be entered as course name (e.g. 'Intro Chemistry')
      class_date: Date the observation occurred in numeric format of MM/DD/YYYY (i.e. 12/31/2017). If you do not know the exact date, you can also enter '1' for first observation, '2', for second observation, and so on.
      semester_recorded: Semester in which course was taught (Fall, Spring, Winter, or Summer).
      year_recorded: Year in which course was taught.
      class_size: Approximate size of class, rounded to nearest 5 students.
      class_layout: Was the arrangement of the classroom 'Fixed' (chairs and/or tables secured to floor, immovable) or 'Flexible' (chairs and/or tables on wheels and movable).
      the 25 COPUS Behaviors: These columns should only contain numbers. For minute-by-minute data, only a 1 or a 0 should be entered for if the behavior was observed or not. For summary data, only numbers should be entered that represent the percent of a class that a behavior was observed and should not contain any symbols or text (i.e. 'NA', '*').

    It is very important to note is that a given instructor can have multiple classes observed on the same day or the same class observed on multiple days or semesters. In order for the COPUS Analyzer to properly account for this, the instructor names needs to be exactly the same as it appears throughout the data.


    Data Upload


    Step 1

    Bear in mind that once you upload your data, we will save a copy on our secure server. For this reason, make sure that the data you upload is de-identified.

    Step 2

    On the About You tab, fill out all the required demographics and whether you are uploading data for single or multiple observations and which format (minute-by-minute template or summary template) you have. Make sure that you are using the correct template for each format.

    Step 3

    Once the demographics survey is completed, you will be able to click the 'Submit' button, which will reveal a new tab. By clicking the submit button, you also agree to have us use your submitted data for our studies.

    Step 4

    After clicking the 'Submit' button, click on the 'COPUS Analyzer' tab (or the 'IRR & Training' tab if you are doing inter-rater reliability). Once on the COPUS Analyzer page, click the 'Browse' button and navigate to the file that you want to upload (excel files only).


    Troubleshooting


    In order for this tool work effectively, please ensure the following:

      1. You are using the correct template - see Data Format section at the top of this page.
      2. Variables within the template are in the exact same order as they appear in the template, have entered all required information, and have deleted rows 2 & 3 from the spreadsheet.
      3. You have selected the appropriate radio buttons on the Demographics Tab (combination of minute-by-minute vs. summary data for single vs. multiple observations).
      4. If you have multiple instructors, classes, and dates that should be grouped, they need to be spelled exactly the same (i.e. if your instructor is called 'Jordan' in one row and 'Jordan H' in another, they will be treated as two different instructors or if the class is 'CHEM 101' in one row and 'CHM 101' in another, they will be treated as two separate classes).
      5. Make sure that you do not have any duplicate rows (same instructor, day, class, semester, and minute, if applicable) as this will cause an error. If you only have instructor name but know that it's the same class on different dates, simply make up a class number/name and dates (but those columns need to be filled). If you're doing inter-rater reliability, you will only need to fill in the observer and instructor columns.
      6. This program might not generate an error message if it does not work. You can assume that the tool has encountered an error if it remains inactive for longer than 30 seconds. If this happens, check that your data is correct and try re-uploading your data.

    If after taking these steps you find errors or wish to provide feedback regarding its functions, please contact Marilyne Stains or Jordan Harshman . If you cannot get the tool to work, please include the data you are trying to upload in your email.

    COPUS Analyzer

    BY CATEGORY ------------------

    BY BEHAVIOR ------------------

    ALL OBSERVATIONS FOR INSTRUCTOR ------------------

    PROMPTS FOR REFLECTION ------------------

    As you use the Analyzer, we encourage you to think about what these data mean for your instruction. Please consider these specific questions:

      1. Which teaching behaviors were most common in your COPUS profile? Do these behaviors match your instructional approaches and goals?
      2. Looking at your COUPS profile, what surpised you or differed from how you thought the class went?
      3. How do your observed teaching behaviors align with evidence-based teaching practices from your discipline?
      4. Based on the information on this page, which aspects of your teaching seemed effective and which might be changed in the future?


    COPUS Analyzer

    ALL OBSERVATIONS FOR INSTRUCTOR ------------------

    INSTRUCTIONAL PROFILE ------------------

    As you use the Analyzer, we encourage you to think about what these data mean for your instruction. Please consider these specific questions:

      1. Which teaching behaviors were most common in your COPUS profile? Do these behaviors match your instructional approaches and goals?
      2. Looking at your COUPS profile, what surpised you or differed from how you thought the class went?
      3. How do your observed teaching behaviors align with evidence-based teaching practices from your discipline?
      4. Based on the information on this page, which aspects of your teaching seemed effective and which might be changed in the future?


    COPUS Analyzer

    BY CATEGORY ------------------

    BY BEHAVIOR ------------------

    INSTRUCTIONAL PROFILE ------------------

    As you use the Analyzer, we encourage you to think about what these data mean for your instruction. Please consider these specific questions:

      1. Which teaching behaviors were most common in your COPUS profile? Do these behaviors match your instructional approaches and goals?
      2. Looking at your COUPS profile, what surpised you or differed from how you thought the class went?
      3. How do your observed teaching behaviors align with evidence-based teaching practices from your discipline?
      4. Based on the information on this page, which aspects of your teaching seemed effective and which might be changed in the future?


    COPUS Analyzer

    INSTRUCTIONAL PROFILE ------------------

    As you use the Analyzer, we encourage you to think about what these data mean for your instruction. Please consider these specific questions:

      1. Which teaching behaviors were most common in your COPUS profile? Do these behaviors match your instructional approaches and goals?
      2. Looking at your COUPS profile, what surpised you or differed from how you thought the class went?
      3. How do your observed teaching behaviors align with evidence-based teaching practices from your discipline?
      4. Based on the information on this page, which aspects of your teaching seemed effective and which might be changed in the future?

    Logged observations

    One row per interval.

    COPUS IRR